Plan, compare, decide.
Use scenarios to maximize the impact of your decarbonization strategy by grouping all your actions in one place. Forecast outcomes, track progress to stay on target, and integrate financial data to support informed strategic decisions.
Many teams create one scenario per target (e.g., Scopes 1 & 2, Scope 3 upstream) to keep things clear. You can also duplicate a scenario as a sandbox to try different targets, growth rates, or action bundles. Create as many scenarios as you need.TABLE OF CONTENTS
Setting up scenarios
Create a scenario
Navigate to Carbon Management, then Decarbonization Strategy. From this page, you can create new scenarios. See below for the parameters covered in a scenario.
Name: give the scenario a clear name.
Base year: select the year from which targets are set and progress is tracked over time. The base year should have reliable, verifiable, and complete emissions data to ensure credible comparisons in future years.
Only years with emissions data available in Position Green will be available to select. If you wish to add historical emissions data calculated outside Position Green, contact your Customer Success Manager.Reference year: select the starting point for forecasting future emissions. This is usually the most recent year with complete emissions data and is used together with the growth rate to forecast business as usual and projected emissions.
For example, if you're in the middle of year 2025 reporting, 2024 would typically be your reference year.
Target year: select the year by which you aim to meet your emissions reduction target.
Expected business growth: enter the forecasted business growth on a year-over-year percentage basis. This is used to forecast projected emissions and business as usual emissions.
Including a growth factor is consistent with science-based target logic: absolute emissions should decline over time in line with your pathway, even when the business grows.Select scopes to include in the scenario: choose which scopes and categories to include in your scenario.
Note: Decarbonization Strategy uses market-based emissions for Scope 2.
Decarbonization target: enter targets either per scope or on a combined basis (e.g. a combined Scope 1 & 2 target).
Edit a scenario
Once a scenario has been created, you can always edit the parameters by clicking the Edit button in the upper right-hand corner.

Duplicate or Delete
You can duplicate or delete a scenario by clicking the three dots in the upper right-hand corner.

Duplicate a scenario to create a safe copy for testing different growth assumptions, target years, or action mixes—then compare results and keep the version that works.
What's included in a scenario
Scenario summary
A snapshot of key figures for your scenario.

CO₂e reduction target: The overall emissions reduction target for the scenario, expressed as a percentage reduction from base year emissions.
- If you have set a combined target (e.g. reduce scope 1 & 2 by 50%), that target will appear here.
- If you set separate targets by scope, this will show the weighted target across scopes. This is calculated by weighting the individual Scope 1, 2, and 3 targets according to their share of base year emissions.
OpEx: the total annual change in operational expenditures (OpEx) across all actions in the scenario.
CapEx: the total capital expenditures (CapEx) across all actions in the scenario.
Outlook chart

The Outlook chart shows how your emissions pathway develops over time. It brings together your historically reported emissions, projected emissions, and target trajectory, so you can clearly see whether your planned actions are enough to move away from business as usual and toward your goals.
The chart visualizes the following data points:
- Reported emissions: These are your actual, calculated emissions based on submitted data. They reflect what has been reported to date and are not modified by this module—they serve as the foundation for projections and comparisons.
- Tip: Click "View reported emissions" to explore historical data in Analytics, identify hotspots and find opportunities for actions.
- Business as usual (BAU): Calculated based on your reported emissions in the reference year and expected business growth rate. No decarbonization actions are applied here.
- Projected emissions: Calculated based on your BAU emissions, reduced by adopted decarbonization actions.
- Target trajectory: A linear path from your Base Year to your Target Year based on the emissions reduction target you define.
Actions
Actions represent concrete measures—like efficiency upgrades, fuel switching, or renewable energy sourcing—that change your projected emissions. Add an action to specify its impact and timing, then see how your plan stacks up against your target.

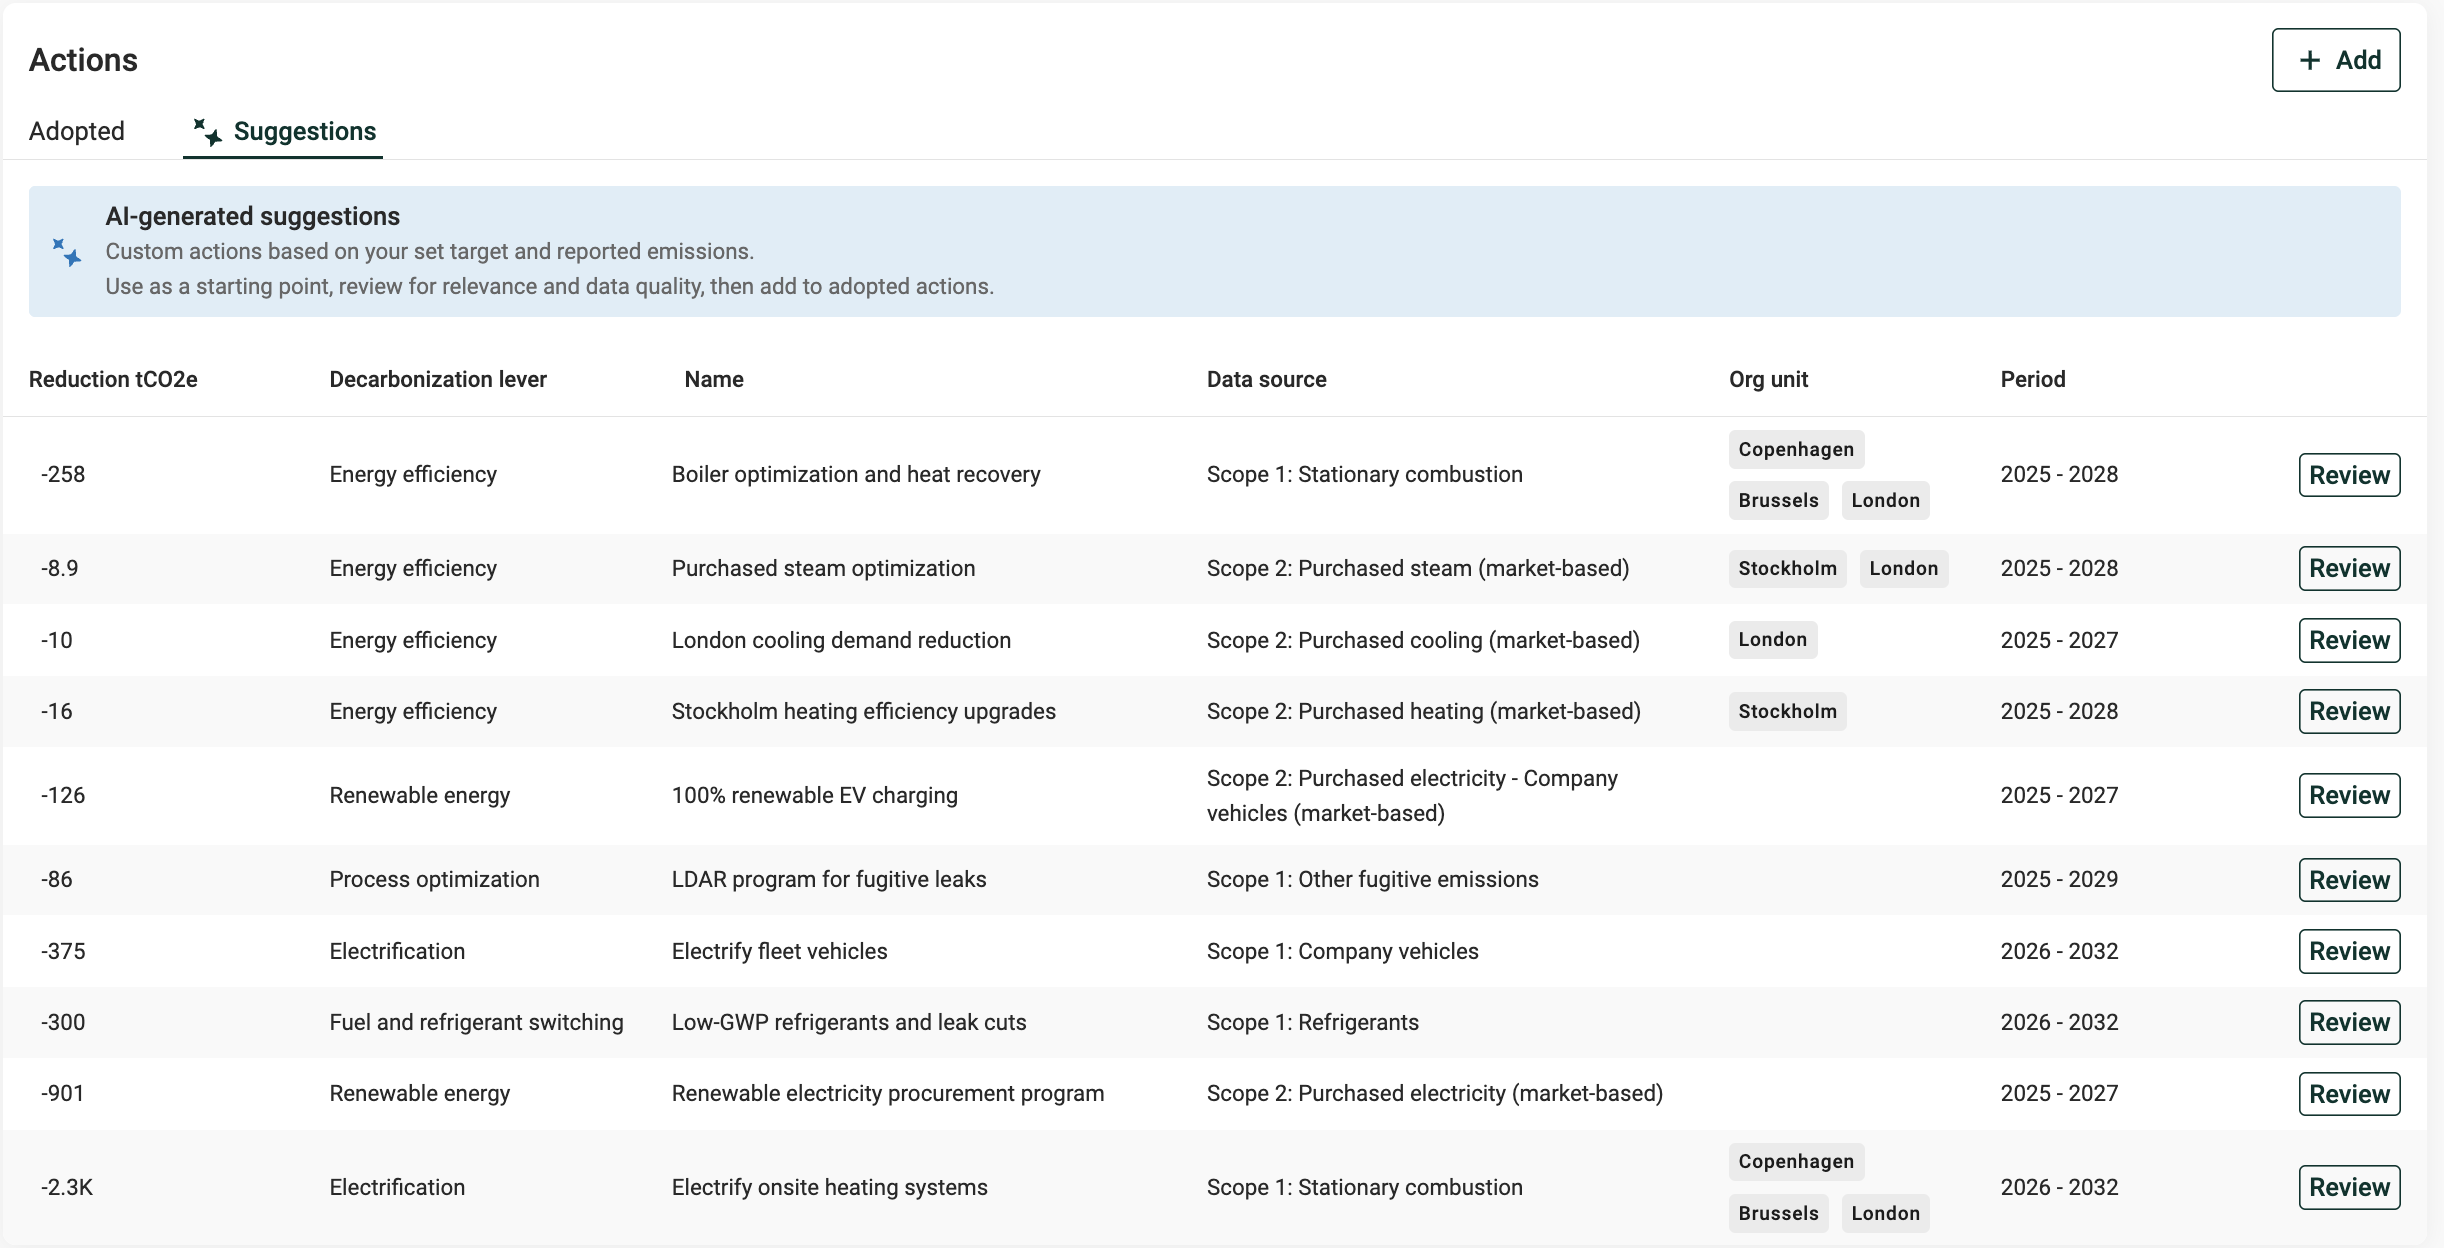
Jump-start with AI-generated suggestions. Once your scenario is set, generate action ideas tailored to your data—complete with impact estimates and rationale. Review, adjust, and adopt them into your plan.
Learn more: How AI-generated suggestions work
Prefer crafting actions yourself? Create actions manually—set reduction %, implementation rate, timing, and costs, then track progress over time.
Learn more: Creating actions
Change analysis chart
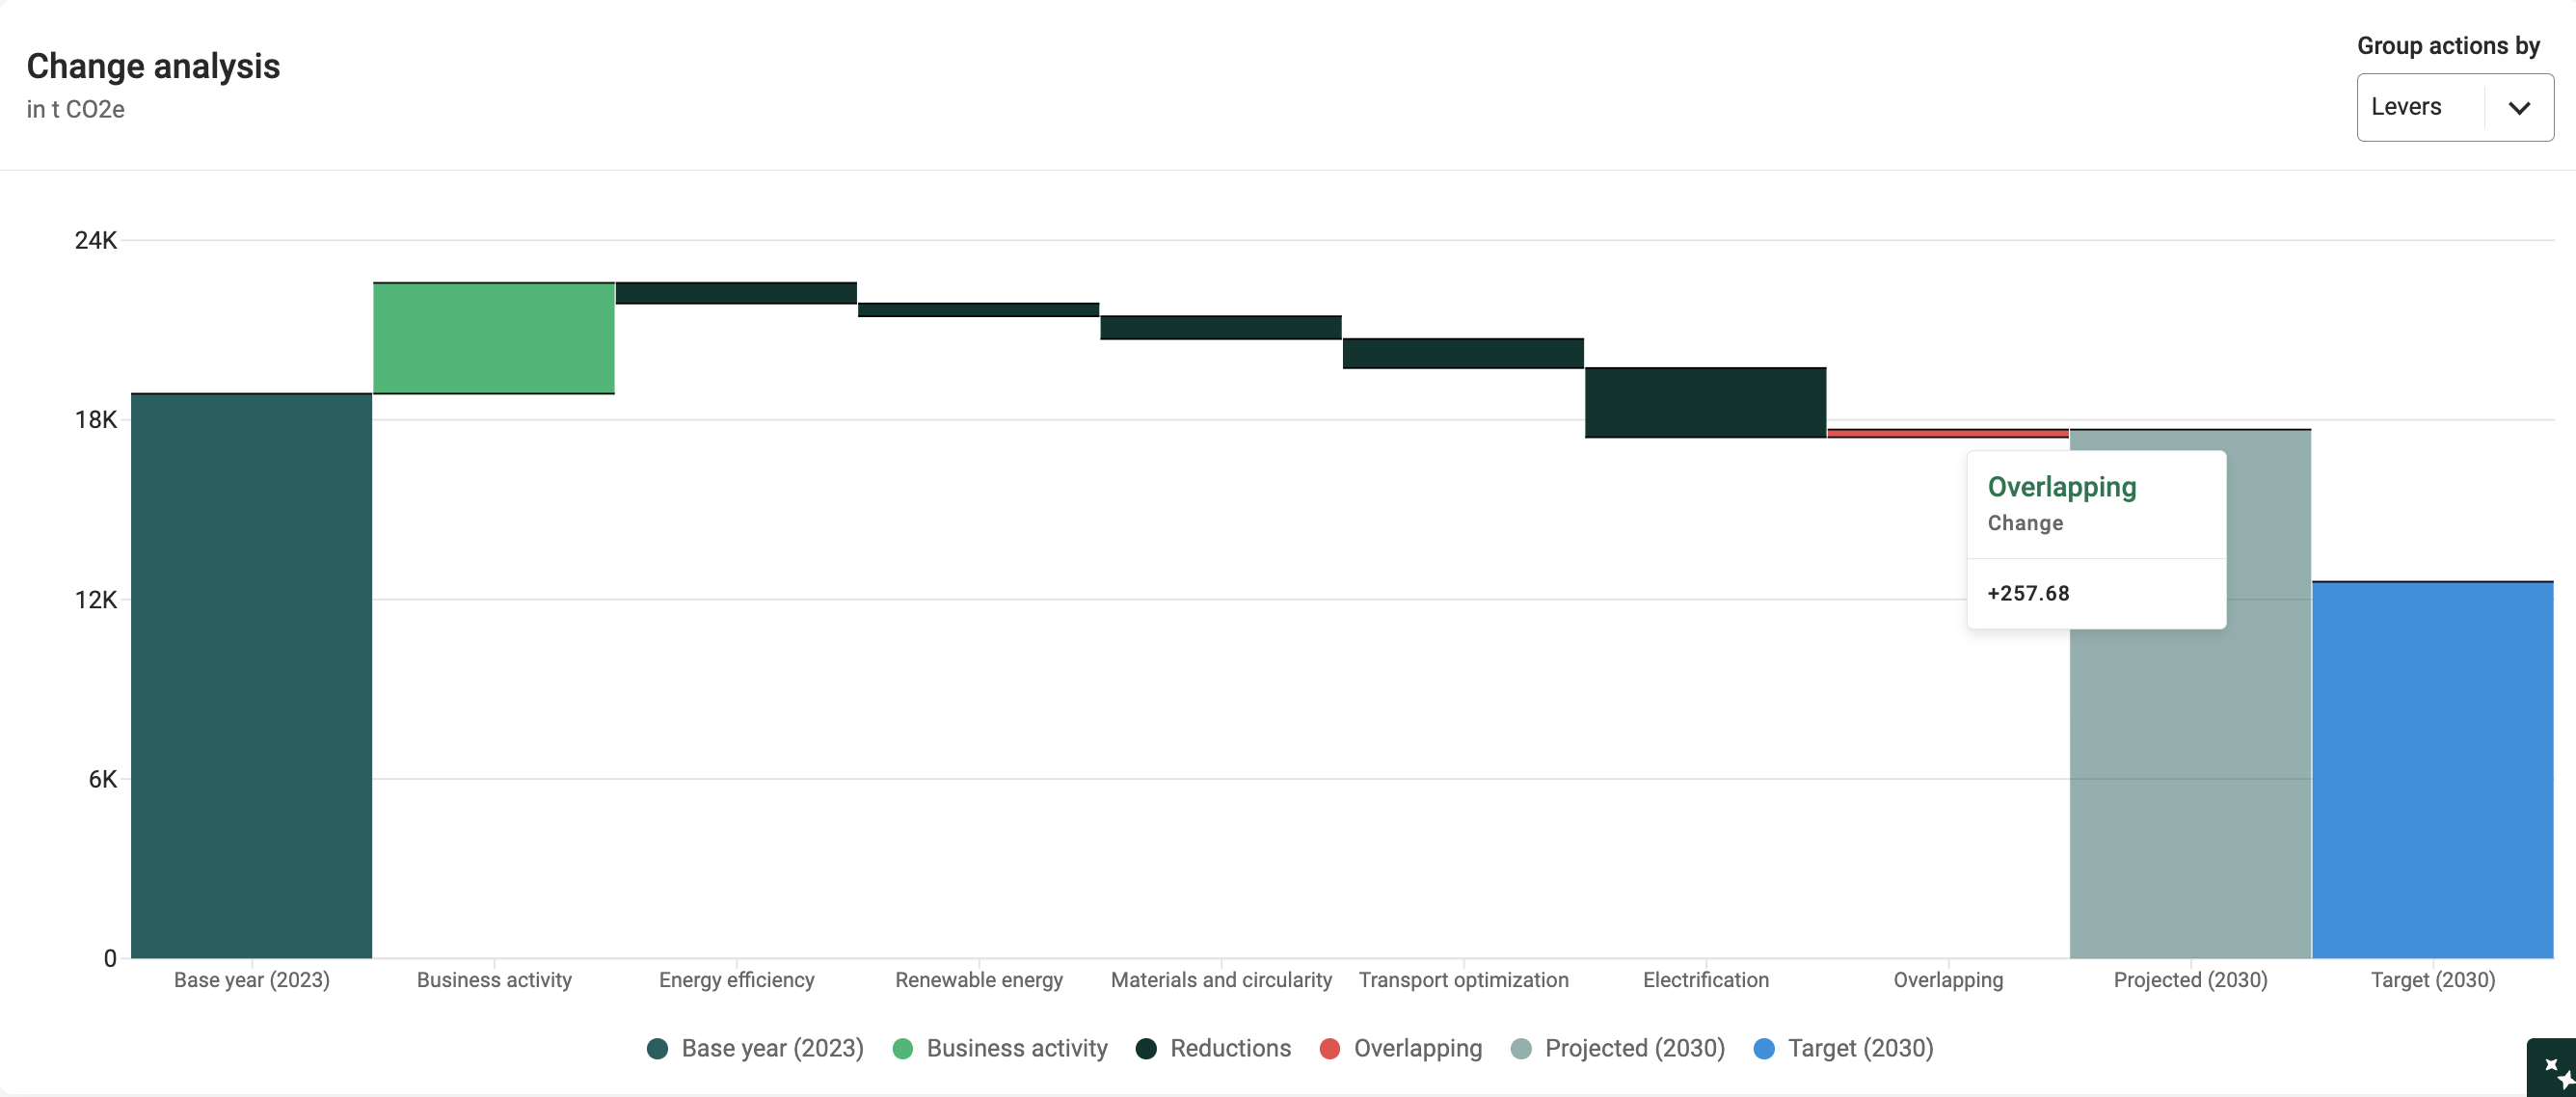
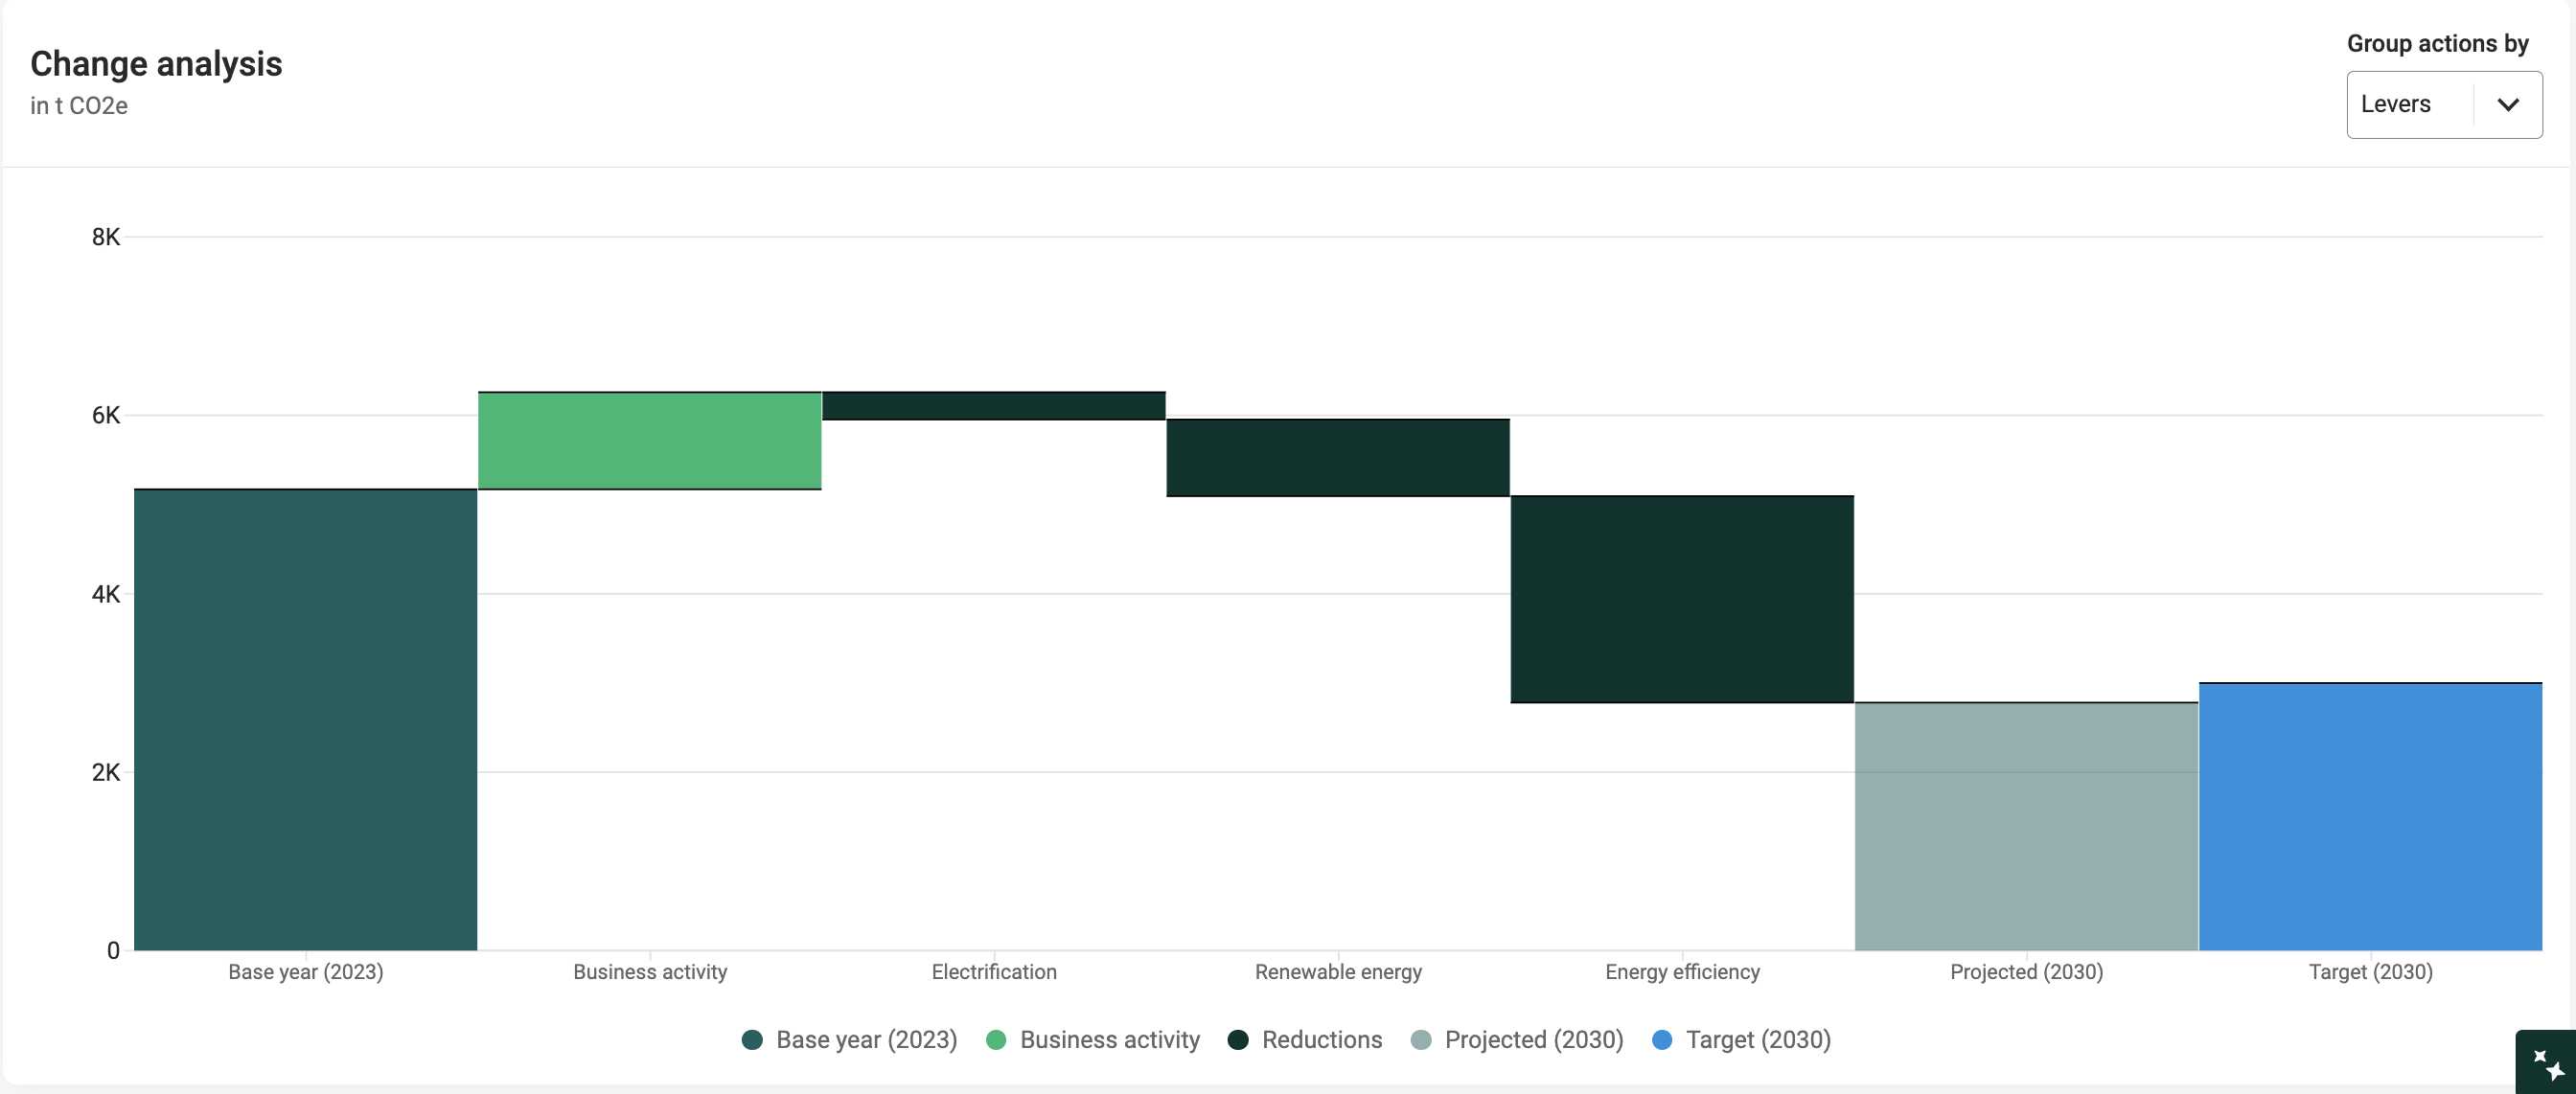
The Change analysis chart is a waterfall view that explains the step-by-step changes from your base year to the target year. It shows:
Base year: your starting point.
Business activity: represents the change in emissions resulting from business activity if no decarbonization actions are applied. It is calculated as the difference between base year emissions and business-as-usual emissions in the target year — which may reflect either growth or reduction depending on how operations or activity levels have changed over time.
Reductions: reductions achieved by the actions in the scenario. These are grouped by decarbonization lever by default, and the view can be changed using the "Group actions by" dropdown.
Projected: total emissions in the target year after applying growth and actions.
Target: your chosen goal for the target year.
This chart helps you see the contribution of each factor—growth pressures, individual actions, and the resulting projection—so you can quickly judge whether the combined actions are sufficient to close the gap to your target.
Overlapping Actions
If you model multiple actions that affect the same emissions source, an additional bar labeled "Overlapping" may appear. This adds back overlapping emissions so the chart doesn’t “double count.” To fix this, review the actions to find the conflicts, and adjust parameters accordingly (most often, the implementation rate or org unit selection).
For example, the below chart shows overlapping actions of 257.68 t CO2e.

When reviewing the Actions table below, we can see there are three actions targeting Scope 2: Purchased electricity. In total, these actions would exceed the total emissions for that category, and therefore the excess emission reductions of 257.68 t CO2e are adjusted back in the chart as a quality safeguard.
In this case, the "Energy efficiency" action (257.68 t CO2e) conflicts with the first two actions in the table. To fix this, the actions targeting Scope 2: Purchased electricity should be reviewed and adjusted, either by removing some actions or adjusting parameters.
In this example, most likely the implementation rate should be adjusted across these actions to first reflect the reduction in energy use from efficiency measures (e.g. 20%), then the remaining electricity use can be targeted by on-site solar (e.g. 40%) and EACs (e.g. 40%).

Was this article helpful?
That’s Great!
Thank you for your feedback
Sorry! We couldn't be helpful
Thank you for your feedback
Feedback sent
We appreciate your effort and will try to fix the article
